
Executive summary
Key takeaways
- The median institution in the report’s endowment and foundation peer universe returned 15.3% for the year ended June 30, 2026.
- Q2 2026 dispersion reached 13.1 percentage points between the 5th- and 95th-percentile returns.
- Observation counts differ by period: 921 institutions for Q2, 712 for one year, and 465 for three years.
- Peer position can support oversight, but dispersion alone does not identify the decisions that caused a return difference.
01
Strong returns can conceal very different outcomes
For many endowments and foundations, June 30 closes the fiscal year and anchors the committee’s annual investment review. Brad Alford’s September 2026 report presents strong FY2026 results alongside a wide range of outcomes within the OCIO Analytics Endowments & Foundations Peer Universe.
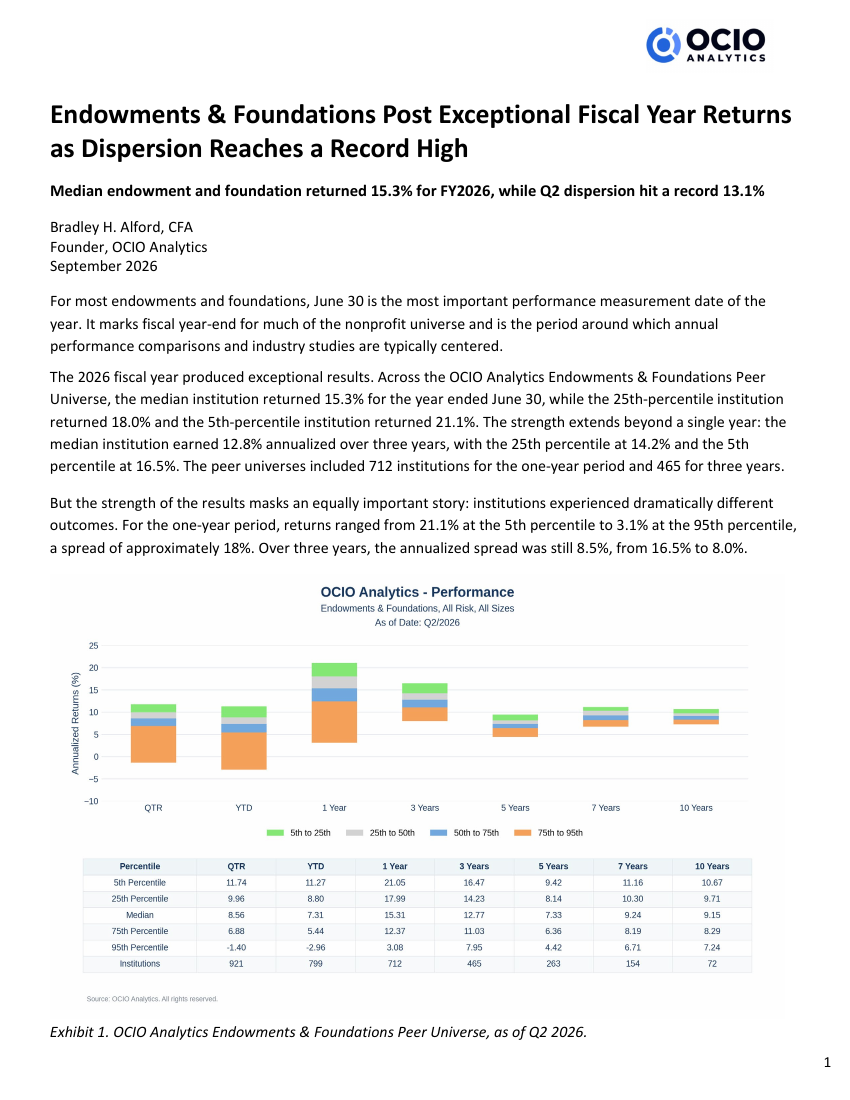
The median one-year return was 15.3%. The report shows 18.0% at the 25th percentile and 21.1% at the 5th percentile. Those are observations from the contributor universe, not a forecast or a promise of what another institution could achieve.
02
Keep the measurement periods separate
The annual and quarterly figures answer different questions. The one-year results cover the year ended June 30, 2026; Q2 covers the final three months. Three-year returns are annualized. Each period uses a different available institution count.
The 5th percentile denotes higher-performing portfolios in the report’s convention, and the 95th percentile denotes lower-performing portfolios.
Scroll horizontally to compare
| Period ended June 30, 2026 | Median | 5th percentile | 95th percentile | Institutions |
|---|---|---|---|---|
| Q2 2026 | 8.6% | 11.7% | −1.4% | 921 |
| One year / FY2026 | 15.3% | 21.1% | 3.1% | 712 |
| Three years, annualized | 12.8% | 16.5% | 8.0% | 465 |
03
A quarter that warrants closer review
Q2 dispersion was 13.1 percentage points, compared with 3.4 points in Q1 2026 and a previous quarterly high of 9.3 points in Q2 2020. The report identifies Q2 2026 as the highest quarterly dispersion in OCIO Analytics’ historical data.
The distribution matters as well as its total width. The difference between the 5th percentile and the median was 3.1 points, while the spread from the 75th to the 95th percentile was 8.3 points. A comparatively small lower-return portion of the universe accounted for much of the overall spread.
04
Use peer evidence to inform oversight
A strong absolute return still needs the context of the institution’s objectives, policy benchmark, risk, and liquidity. The report discusses manager selection, private-market pacing, access, and execution as areas for further analysis when similar high-level allocations produce different outcomes.
Those possible explanations should be investigated rather than inferred from peer position alone. Quarterly returns can be noisy, asset mix and valuation timing can differ, and the observed universe is not the entire market. Committees should use the findings to inform a review across appropriate horizons.