
Executive summary
Key takeaways
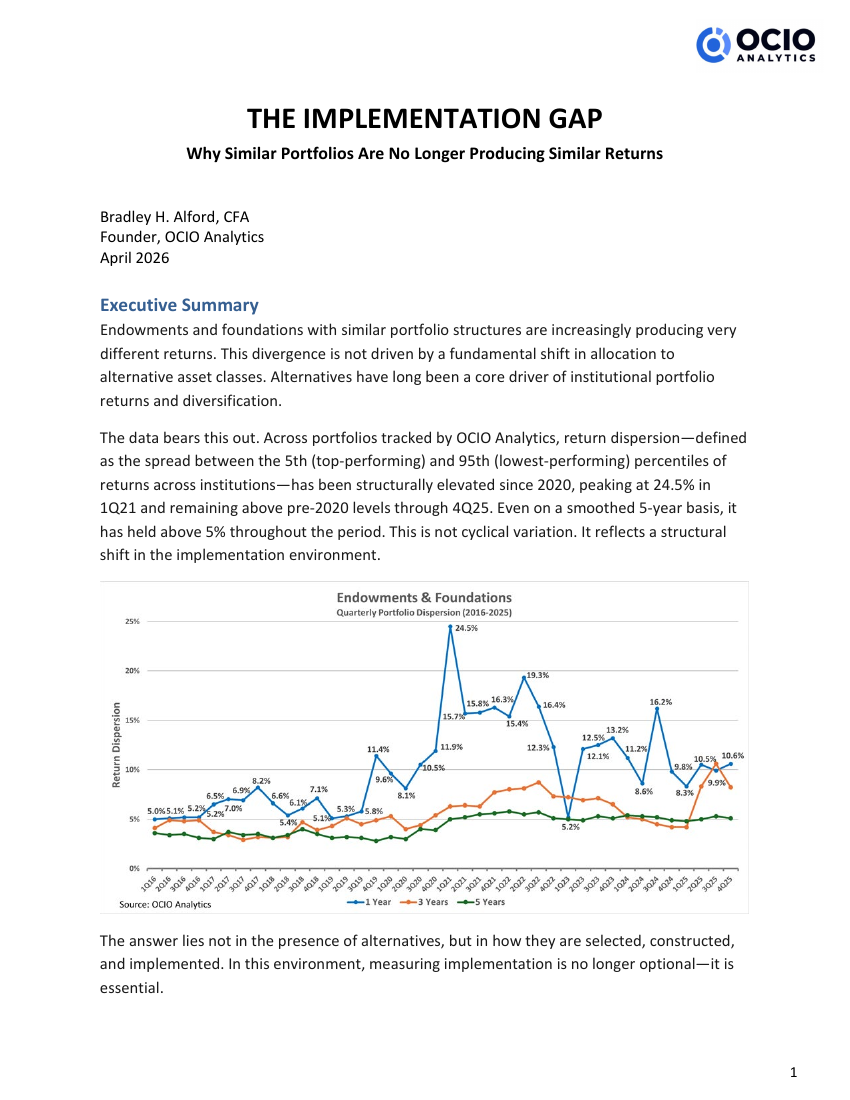
- The paper reports elevated endowment and foundation return dispersion in the OCIO Analytics universe after 2020.
- Broad asset-class allocations do not describe manager selection, vintage years, pacing, liquidity, or strategy exposures.
- The source’s manager chart shows wider quartile spreads in several alternative asset classes than in equities or bonds.
- Those descriptive differences do not isolate manager skill or establish that implementation is the sole cause of portfolio results.
01
Allocation labels are an incomplete description
Two endowments can hold similar allocations to public markets and alternatives while experiencing different returns. Brad Alford’s April 2026 paper examines why the implementation behind those labels deserves more attention.
For a committee evaluating an OCIO, understanding the proposed allocation is only the beginning. The mandate also includes the manager program, underlying strategies, access arrangements, commitment pacing, and liquidity management.
02
The report’s dispersion evidence
The paper defines institutional dispersion as the difference between 5th- and 95th-percentile returns in the OCIO Analytics dataset. It reports a one-year dispersion peak of 24.5 percentage points in Q1 2021 and a five-year annualized spread above 5 points through the period examined.
It also reproduces a J.P. Morgan Asset Management manager-return chart for the ten years ending Q4 2025. The reported 25th-to-75th-percentile spread is 2.6 percentage points for large-cap equities and 1.5 for bonds, compared with 19.5 for private equity, 19.1 for venture capital, and 14.7 for hedge funds.
The manager chart and institutional portfolio observations concern different universes. They should not be combined as if they were directly comparable measures of OCIO performance.
03
Understand the decisions inside the portfolio
Alternative allocations encompass different funds, vintage years, financing structures, cash flows, and valuations. The same allocation percentage can therefore represent different economic exposures.
The source argues that implementation has become a more important differentiator. A committee can use that argument to examine the provider’s investment decisions and evidence rather than assuming that an allocation label explains the result.
- Connect manager and strategy exposures to the institution’s stated objectives.
- Review pacing, liquidity, and valuation conventions when interpreting private-market returns.
- Consider fees, risk, leverage, cash flows, and benchmark differences before attributing outcomes to selection skill.
04
Interpret the findings with care
Observed return spreads identify a range of outcomes, not a return target available to every institution. The data do not by themselves prove the cause of a particular portfolio’s result.
The implication for OCIO oversight is a fuller understanding of what was implemented, how it fits the mandate, and what evidence supports the provider’s explanation over a relevant investment horizon.